While discussing data providers for our components, we realized that not all developers like a query-oriented design (where a dataset-level is hidden as much as possible).
Some people prefer linking a report generator with existing TDataSet components (that may already have master-detail relationships).
We decided to add this possibility to our universal DB data provider.
Now it has a collection property DataSets, containing pairs {DataSet, Name}.
When a report contains a data query equal to Name, the corresponding DataSet is used.
In this way, you can use Report Workshop without using SQL and other query languages.
Which database components do you use?
-
Sergey Tkachenko
- Site Admin
- Posts: 17288
- Joined: Sat Aug 27, 2005 10:28 am
- Contact:
-
Ruediger Kabbasch
- Posts: 17
- Joined: Thu Aug 03, 2006 4:50 pm
- Location: Germany
Maybe you can add support for this one
PostgresDAC
http://www.microolap.com/products/conne ... stgresdac/
PostgresDAC
http://www.microolap.com/products/conne ... stgresdac/
-
Sergey Tkachenko
- Site Admin
- Posts: 17288
- Joined: Sat Aug 27, 2005 10:28 am
- Contact:
There are some design-time issues, but I am sure Microolap team will help me.
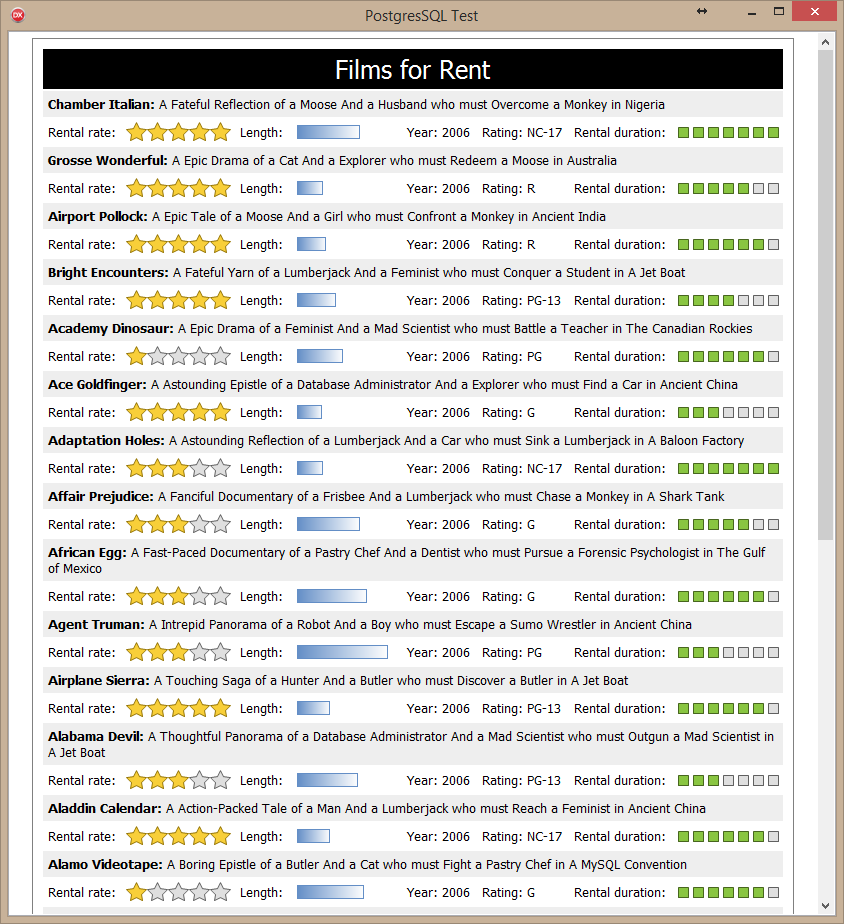
There is an interesting sample database for PostgreSQL: a DVD rental database (Pagila)
Here is a simple report showing data from "film" table using Report Workshop value visualizers:
To be continued ...
Last edited by Sergey Tkachenko on Fri Mar 25, 2016 8:17 pm, edited 1 time in total.
-
Sergey Tkachenko
- Site Admin
- Posts: 17288
- Joined: Sat Aug 27, 2005 10:28 am
- Contact:
One more example on DVD rental database (Pagila AKA Sakila for PostgreSQL), accessed via PostgresDAC.
It has
- table of films (visualized above),
- table of customers,
- table of rentals, linking films and customers (films are linked indirectly, via inventory table).
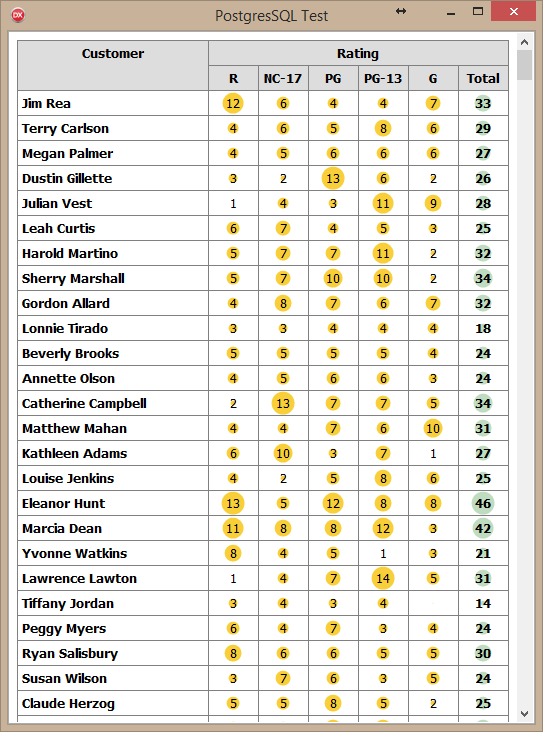
Let's join these tables to show dependences between customers and ratings of films they choose:
The result is like this:

It's not very easy to analyze, is it?
Report Workshop can display it as a cross-tab table (with some value visualization). Customers are in rows, film ratings are in columns, counts of rented films are in intersections.
Ok, other reporting tools also offer cross-tabs (may be not as comprehensive as in Report Workshop )
)
But what's about sub-report in each cross-tab cell? We can display rented films' titles instead of simple count of films.
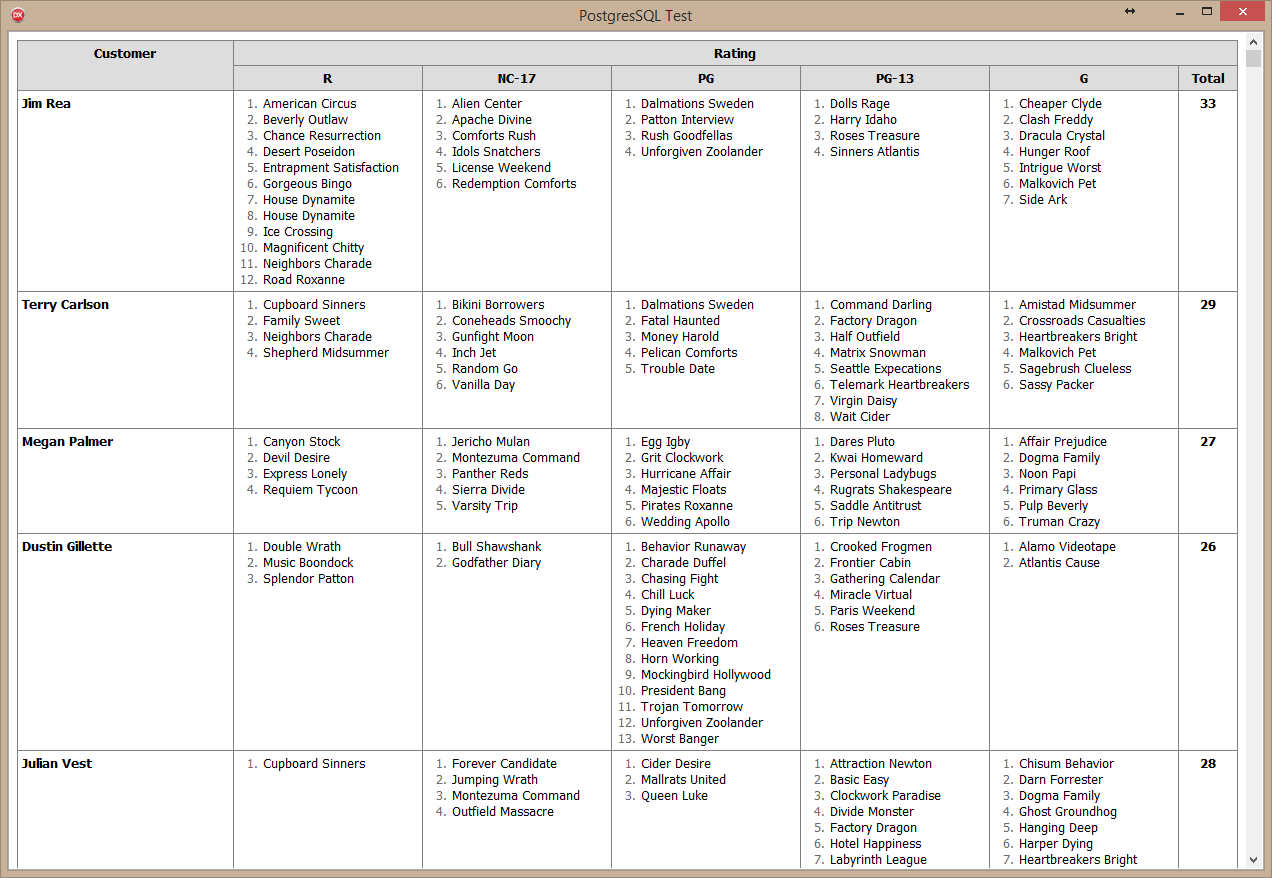
(it's not very efficient kind of report, because each detail query is a complex select join statement, so you need to wait for a minute while this report is generated, but the result is worth it)
UPDATE: it appeared that the main delay in generation of the last report was caused by inefficient processing of paragraph numbering; after optimizing, this report is built in about 12 sec.
It has
- table of films (visualized above),
- table of customers,
- table of rentals, linking films and customers (films are linked indirectly, via inventory table).
Let's join these tables to show dependences between customers and ratings of films they choose:
Code: Select all
    'SELECT customer.customer_id, customer.first_name, customer.last_name, '+
    'film.rating, count(film.film_id) as count '+
    'FROM rental INNER JOIN customer ON rental.customer_id = customer.customer_id '+
    'INNER JOIN inventory ON rental.inventory_id = inventory.inventory_id '+
    'INNER JOIN film ON inventory.film_id = film.film_id '+
'GROUP BY customer.customer_id, film.rating'It's not very easy to analyze, is it?
Report Workshop can display it as a cross-tab table (with some value visualization). Customers are in rows, film ratings are in columns, counts of rented films are in intersections.
Ok, other reporting tools also offer cross-tabs (may be not as comprehensive as in Report Workshop
But what's about sub-report in each cross-tab cell? We can display rented films' titles instead of simple count of films.
(it's not very efficient kind of report, because each detail query is a complex select join statement, so you need to wait for a minute while this report is generated, but the result is worth it)
UPDATE: it appeared that the main delay in generation of the last report was caused by inefficient processing of paragraph numbering; after optimizing, this report is built in about 12 sec.
-
Sergey Tkachenko
- Site Admin
- Posts: 17288
- Joined: Sat Aug 27, 2005 10:28 am
- Contact:
I want to show one more example using MySQL demo database: world.
This database has the table "country" containing fields Continent, Region, Name, SurfaceArea, Population, LifeExpectancy.
Let's show a report for this table, containing:
- regions grouped by continents (continent name above the details)
- countries grouped by regions (region name to the left of the details)
- two summary rows (sums and averages) for regions, continents, and world.
Previous examples used nested documents as subreports (cells are subreports for table rows, rows of nested tables are subreports for cells, and so on).
In this example, I want to show a different approach. A single table will contain nested subreports.
We define a group of rows as a report, then some range of cells in these rows as its subreport, and a range of cells of this subreport as sub-subreport.
Here is the template with highlighted areas associated with SQL data queries:
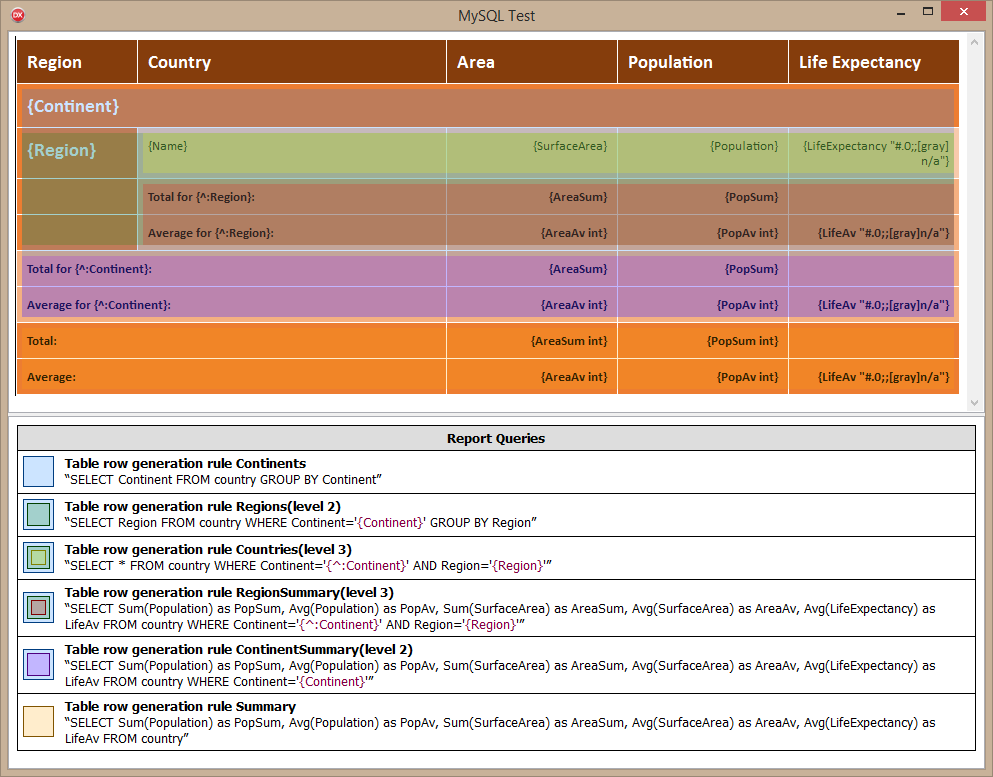
Probably, it's more clear if we remove table background colors:
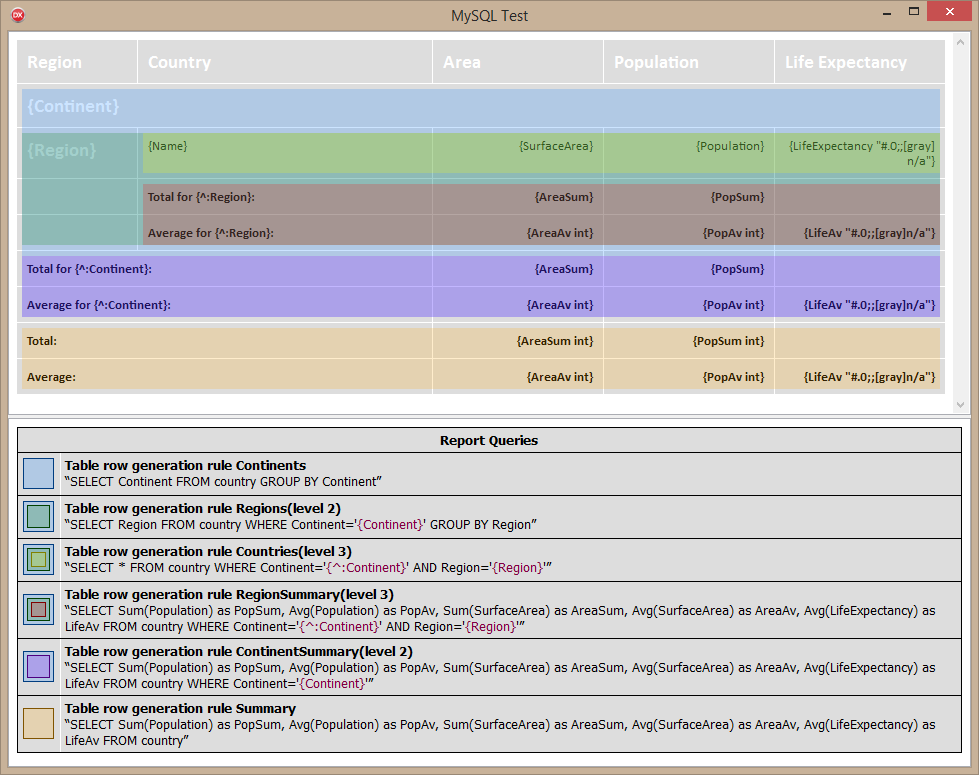
At the top side of the window, you can see a report template. At the bottom side you can see a report summary.
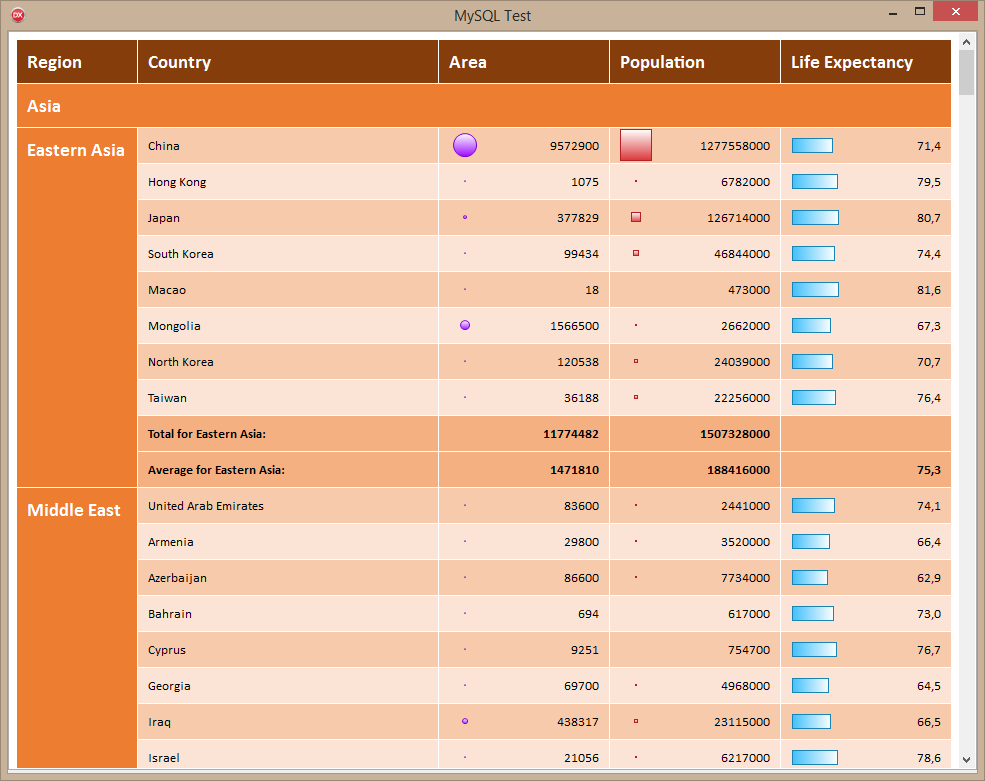
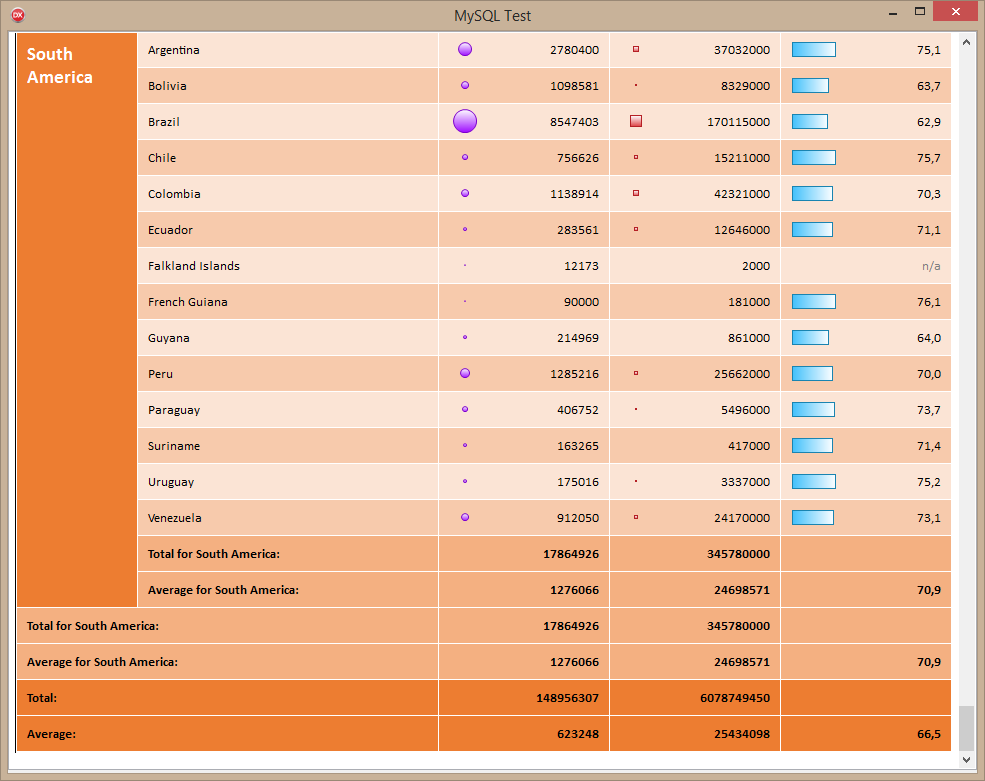
Here are the results:
top
bottom (in this table, "South America" is a name of both a continent and a region)
Some notes about field syntax
- {FieldName int} means that field value is type-casted to integer number
- {FieldName "formatstring"} means that format string is applied to the output; in this example, we display zero values as grayed "n/a"
- {^:FieldName} means that FieldName is taken from the results of the parent query (we could also refer to them by names)
Well, I had doubts if I should show this example, it's a bit overcomplicated for an introduction, but finally I decided to publish it here.
-
Sergey Tkachenko
- Site Admin
- Posts: 17288
- Joined: Sat Aug 27, 2005 10:28 am
- Contact:
That's all for now. Unless developers of DB components contact us, we add additional data providers after the release.
Now we need to add latest changes in the documentation, create packages, installer, demos - and finally release it.