TRVReportGaugeVisualizer visualizes numeric values by displaying them on a gauge.
Unit RVReportValueVisualizer;
Syntax
TRVReportGaugeVisualizer = class (TRVReportCustomValueVisualizer)
TObject TPersistent TCollectionItem |
Description
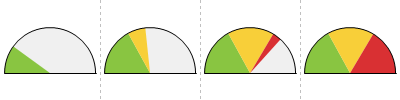
This visualizer shows a gauge and fills it from the left side to the position corresponding to the value.
This visualizer is useful for displaying values that can be separated into "good", "neutral" and "bad" categories. They are displayed as "green", "yellow" and "red" areas of a gauge.
By default, large values are "bad" values, but you can reverse it using RedLowValues property.
You can define relative sizes and colors of these areas.
This visualizer overrides initial values of MinValue, MaxValue, AutoMinValue, AutoMaxValue properties: MinValue = 0, MaxValue = 100, and they are not modified while generating reports.
All values less than MinValue are displayed as MinValue, all values greater than MaxValue are displayed as MaxValue.
Gauges can be filled using all area colors, or by a single color, depending on SingleColorMode.
Gauge size may be limited by MaxSize.
Examples
The examples use the following data:
20 |
46.7 |
73.3 |
100 |
Example 1: Default property values

Example 2: RedLowValues = True
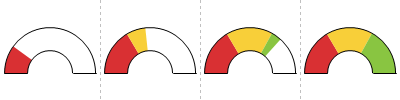
Example 3: LineColor = clNone

Example 4: SingleColorMode = True
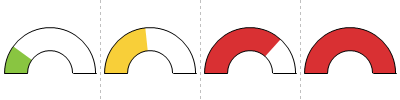
Example 5: MiddleColor = clNone, Color= $F0F0F0