Data visualizers may be associated with cells of report tables.
There are two group of visualizers:
•for changing background colors depending on values
•for displaying diagrams that visualize values (a diagram is drawn on top on the standard cell background, but below the cell content)
The same cell may have both a color changer and a diagram.
This feature is similar to conditional formatting that can be found in Microsoft Excel, however, there are important differences:
•in Excel, you can visualize the same value as entered in the cell; in Report Workshop, this value is specified separately. So you can, for example, display a price, but show an icon identifying the price change; or show a movie title, but visualize its rating
•Report Workshop does not use raster images to visualize values, so diagrams may be of any size and printed without losing quality
All visualizers are inherited from TRVReportCustomValueVisualizerBase. It defines the string that must be evaluated to get values for each cell, and specify how minimal and maximal values are calculated.
The first group of visualizers (color changers) are represented by a single class: TRVReportColorChangerItem.
The second group of visualizers (value visualizers displaying diagrams) include:
TRVReportAreaSizeVisualizer: displays a shape having the area proportional to the value

TRVReportColoredShapeVisualizer: displays a shape having colors and rotation depending on the value

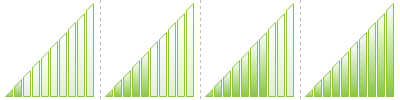
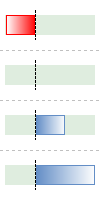
TRVReportBarVisualizer: displays a horizontal or vertical bar having length proportional to the value
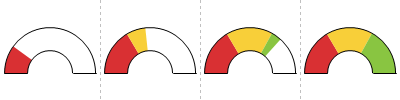
TRVReportGaugeVisualizer: displays a gauge
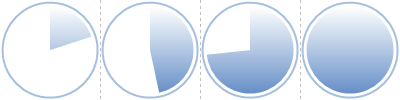
TRVReportPieVisualizer: displays a pie slice having an angle proportional to the value
TRVReportShapeRepeaterVisualizer: displays the count of shapes proportional to the value

TRVReportSignalStrengthVisualizer: displays a diagram that is usually used to show a signal strength or a volume