TRVReportBarVisualizer visualizes numeric values by displaying bars having lengths proportional to these values.
Unit RVReportValueVisualizer;
Syntax
TRVReportBarVisualizer = class (TRVReportCustomValueVisualizer)
TObject TPersistent TCollectionItem |
Description
This visualizer shows bars having lengths proportional to visualized values.
Bar lengths are calculated for absolute values.
AxisPosition defines how negative values and axis are displayed.
Bars can be directed from left to right, from right to left, from top to bottom, from bottom to top, depending on BarDirection.
Bars for positive values are drawn with Color and LineColor, bars for negative values are drawn using NegativeColor and NegativeLineColor. Background can be solid or gradient.
Optionally, a background is drawn using BackgroundColor and BackgroundOpacity properties.
An axis, if visible, is drawn using AxisColor.
Widths of bars are defined in FitWidth and MaxWidth properties.
Examples
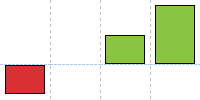
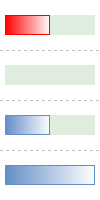
These examples display the following values:
-50 |
0 |
50 |
100 |
MinValue = -50, MaxValue = 100.
Example 1:
AxisPosition = rvrbapSide, Gradient = True, BarDirection = rvrbdRight (default), Color = $C68E63 (default), NegativeColor = clRed (default), LineColor = Color, NegativeLineColor = NegativeColor, Margin = 5, BackgroundColor = clMoneyGreen
Example 2
AxisPosition = rvrbapAuto (default), Gradient = False (default), BarDirection = rvrbdUp, Color = $41C589, NegativeColor = $3330D9, LineColor = clBlack (default), NegativeLineColor = clNone (default), Margin = 5, , BackgroundColor = clNone (default), AxisColor = clSkyBlue